Search "Meter Helper" on Huawei AppGallery, or obtain the APK from the distribution channel.
If installing via APK, enable "Install from unknown sources" in system settings.
After installation, tap the "Meter Helper" icon to launch.
On first launch, grant Bluetooth and Location permissions when prompted.
iOS Installation
Search "Meter Helper" on the App Store. Grant Bluetooth and Location permissions on first launch.
HarmonyOS Installation
Download "Meter Helper" from Huawei AppGallery. Grant Bluetooth, Location and Camera permissions on first launch.
First Launch
On first launch, the app initializes device configurations, local database, and language settings. This typically takes 1–2 seconds. If initialization fails, an error page is shown — please restart the app.
三、界面总览
应用采用底部导航栏设计,共 5 个主要标签页:
标签名
功能概述
扫描连接
扫描蓝牙设备并建立连接
数据采集
查看实时采集的仪表数据
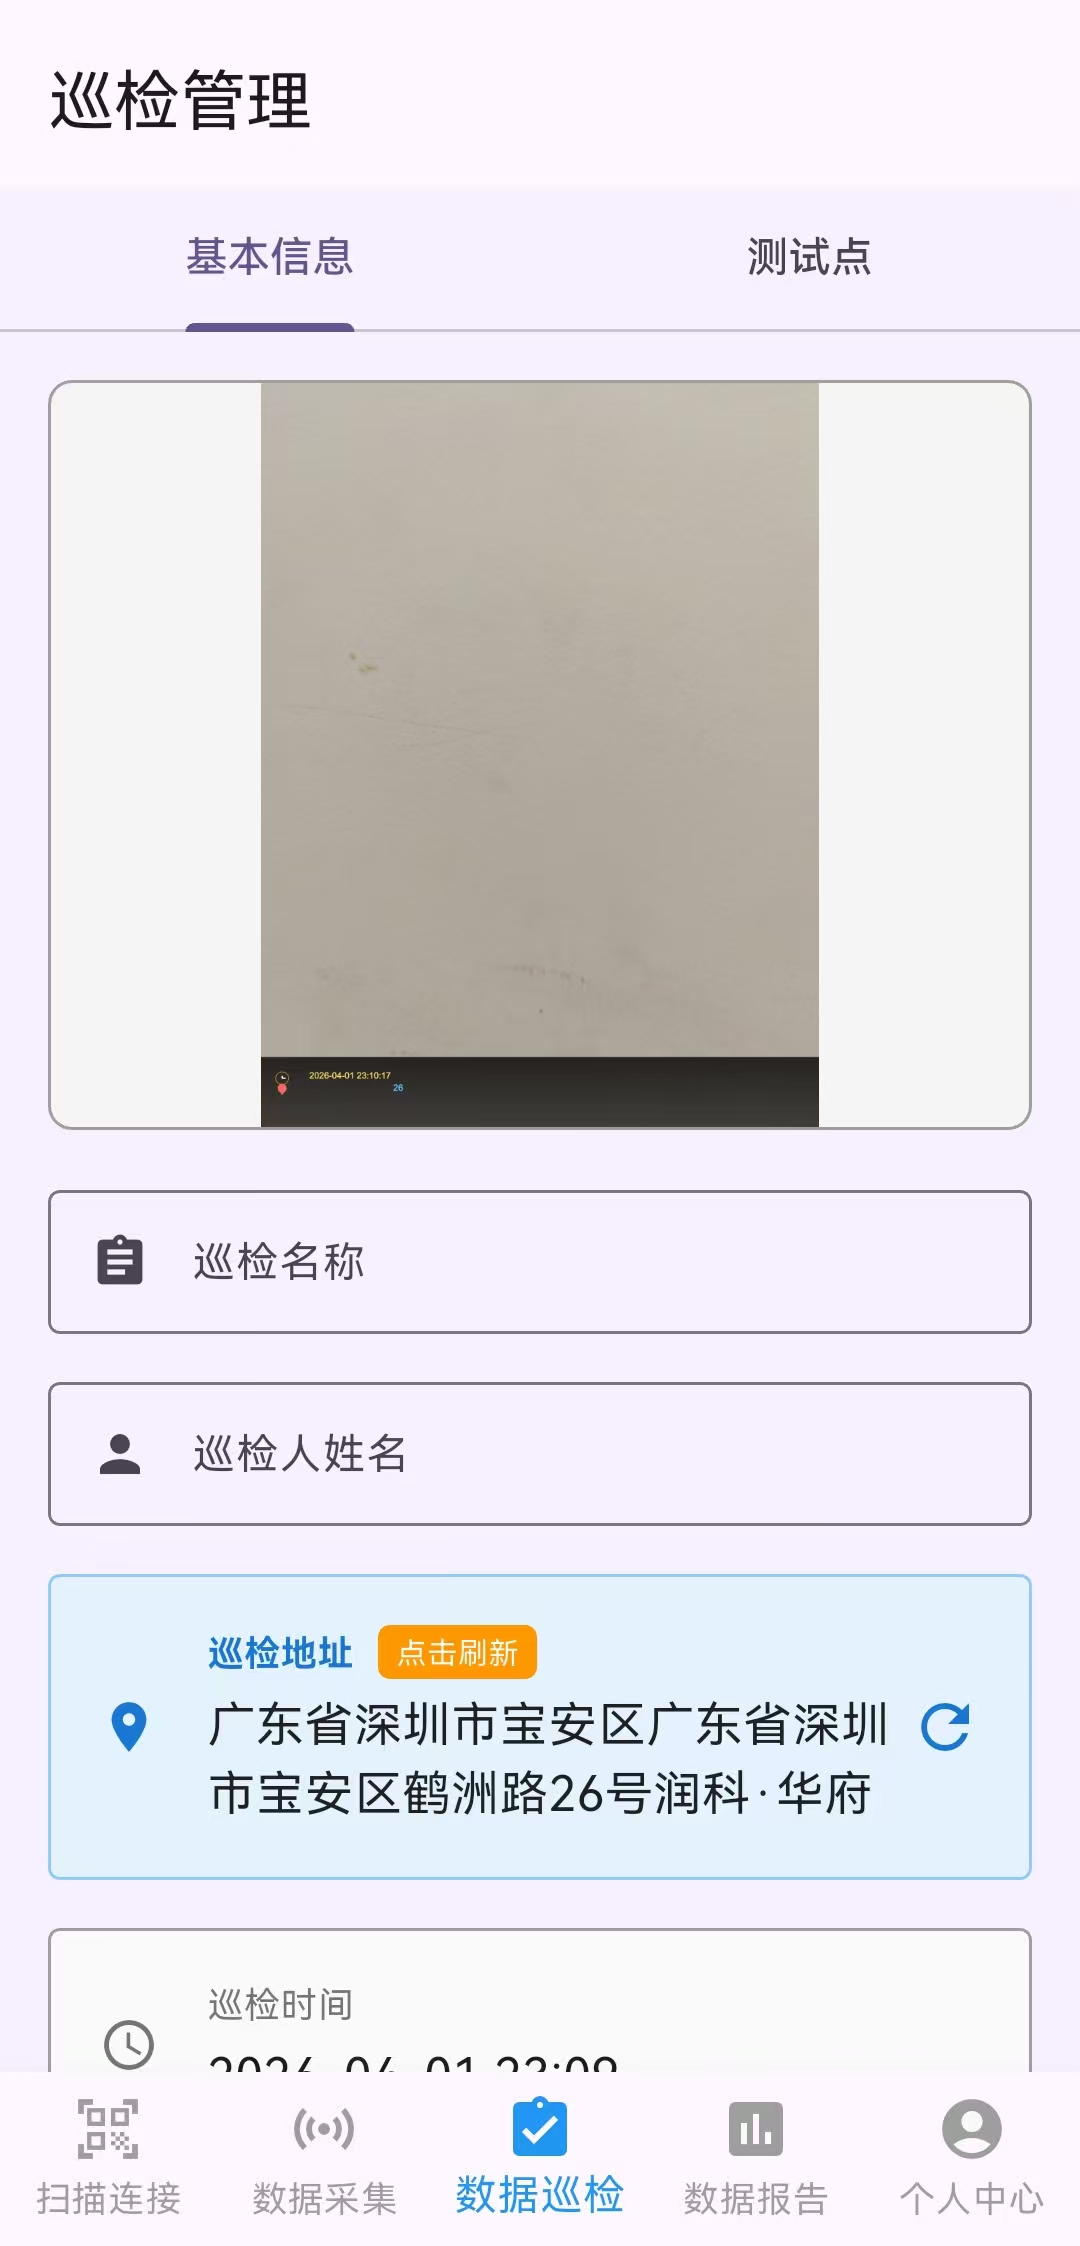
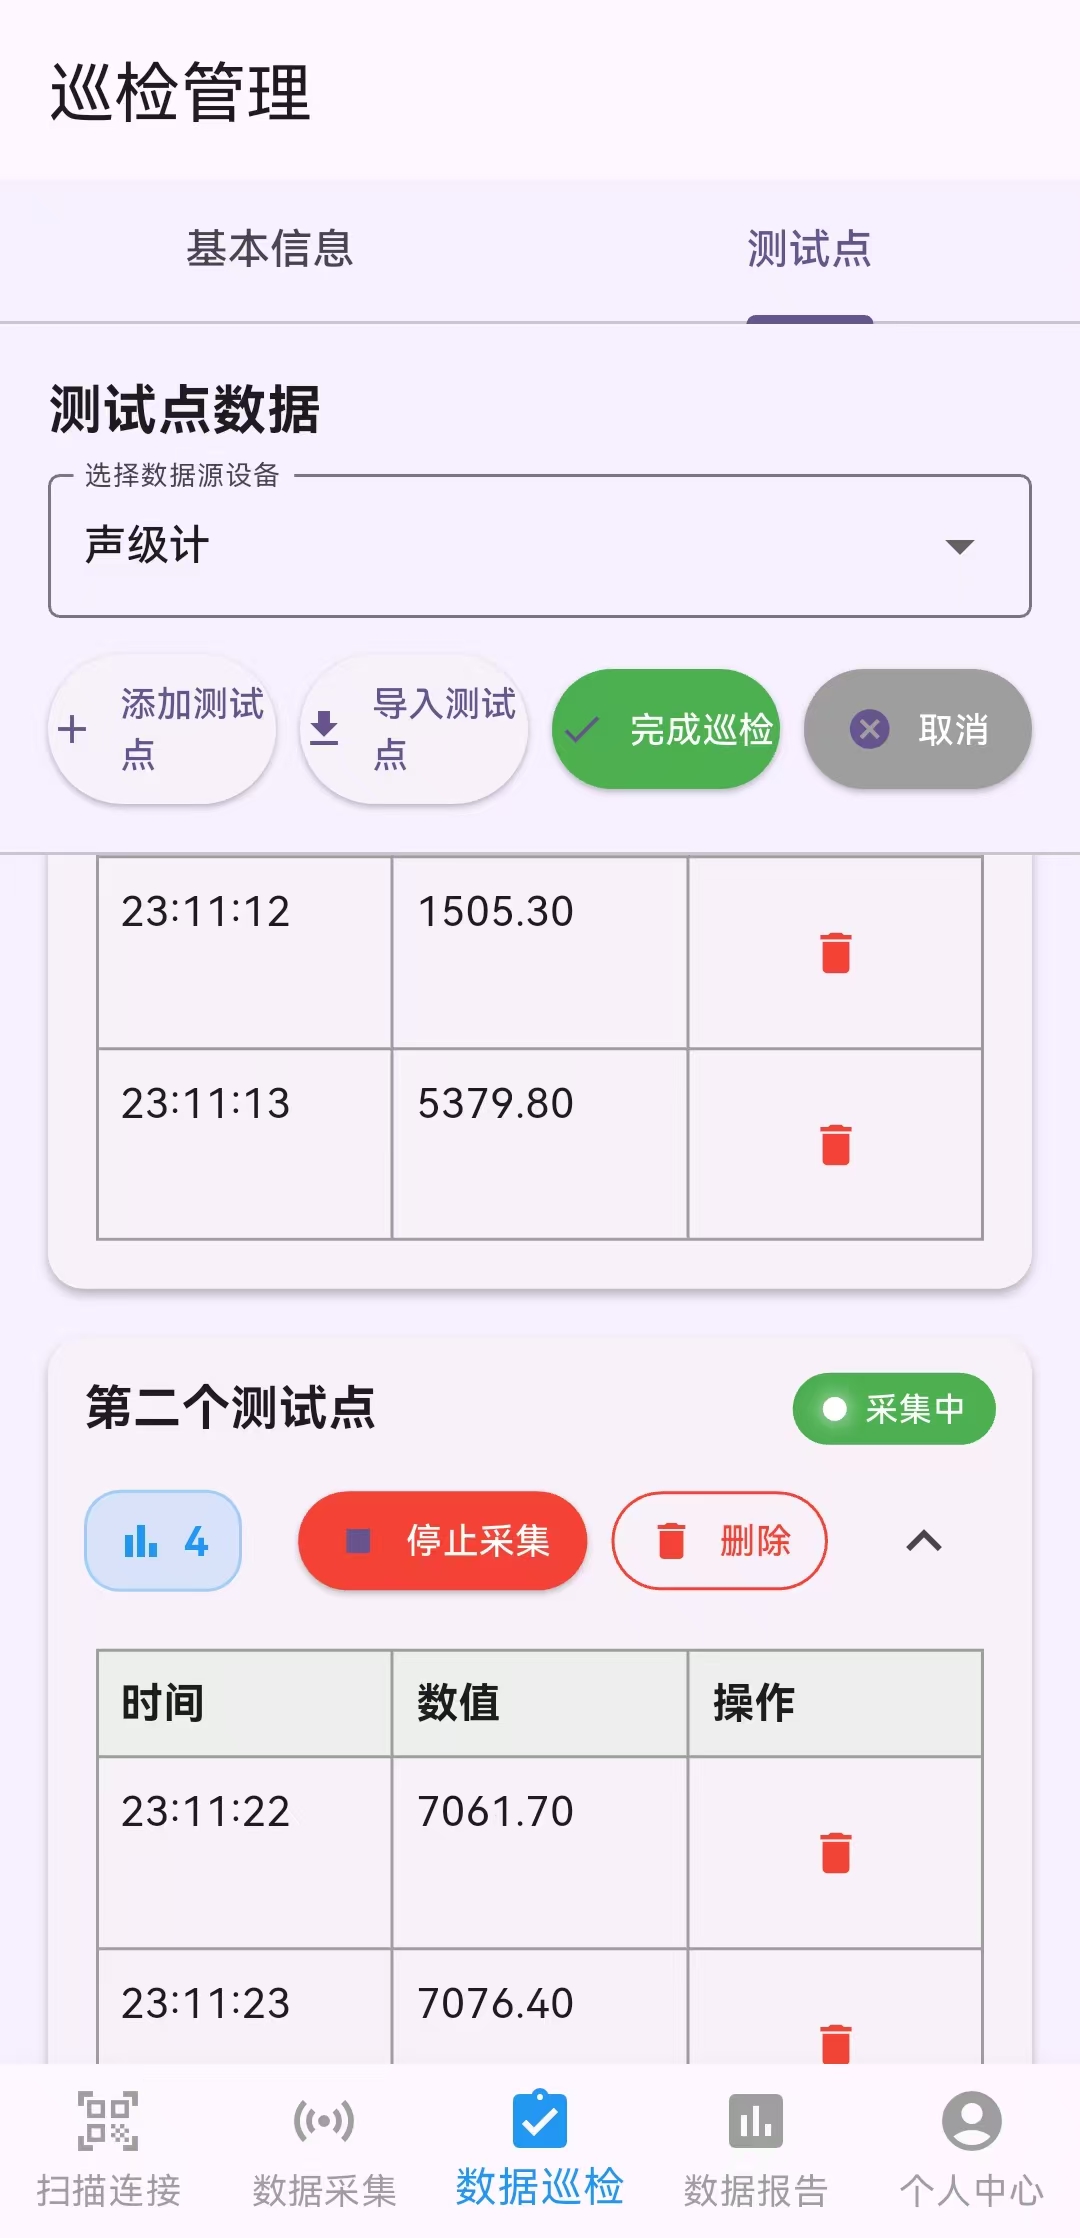
数据巡检
创建和执行巡检任务
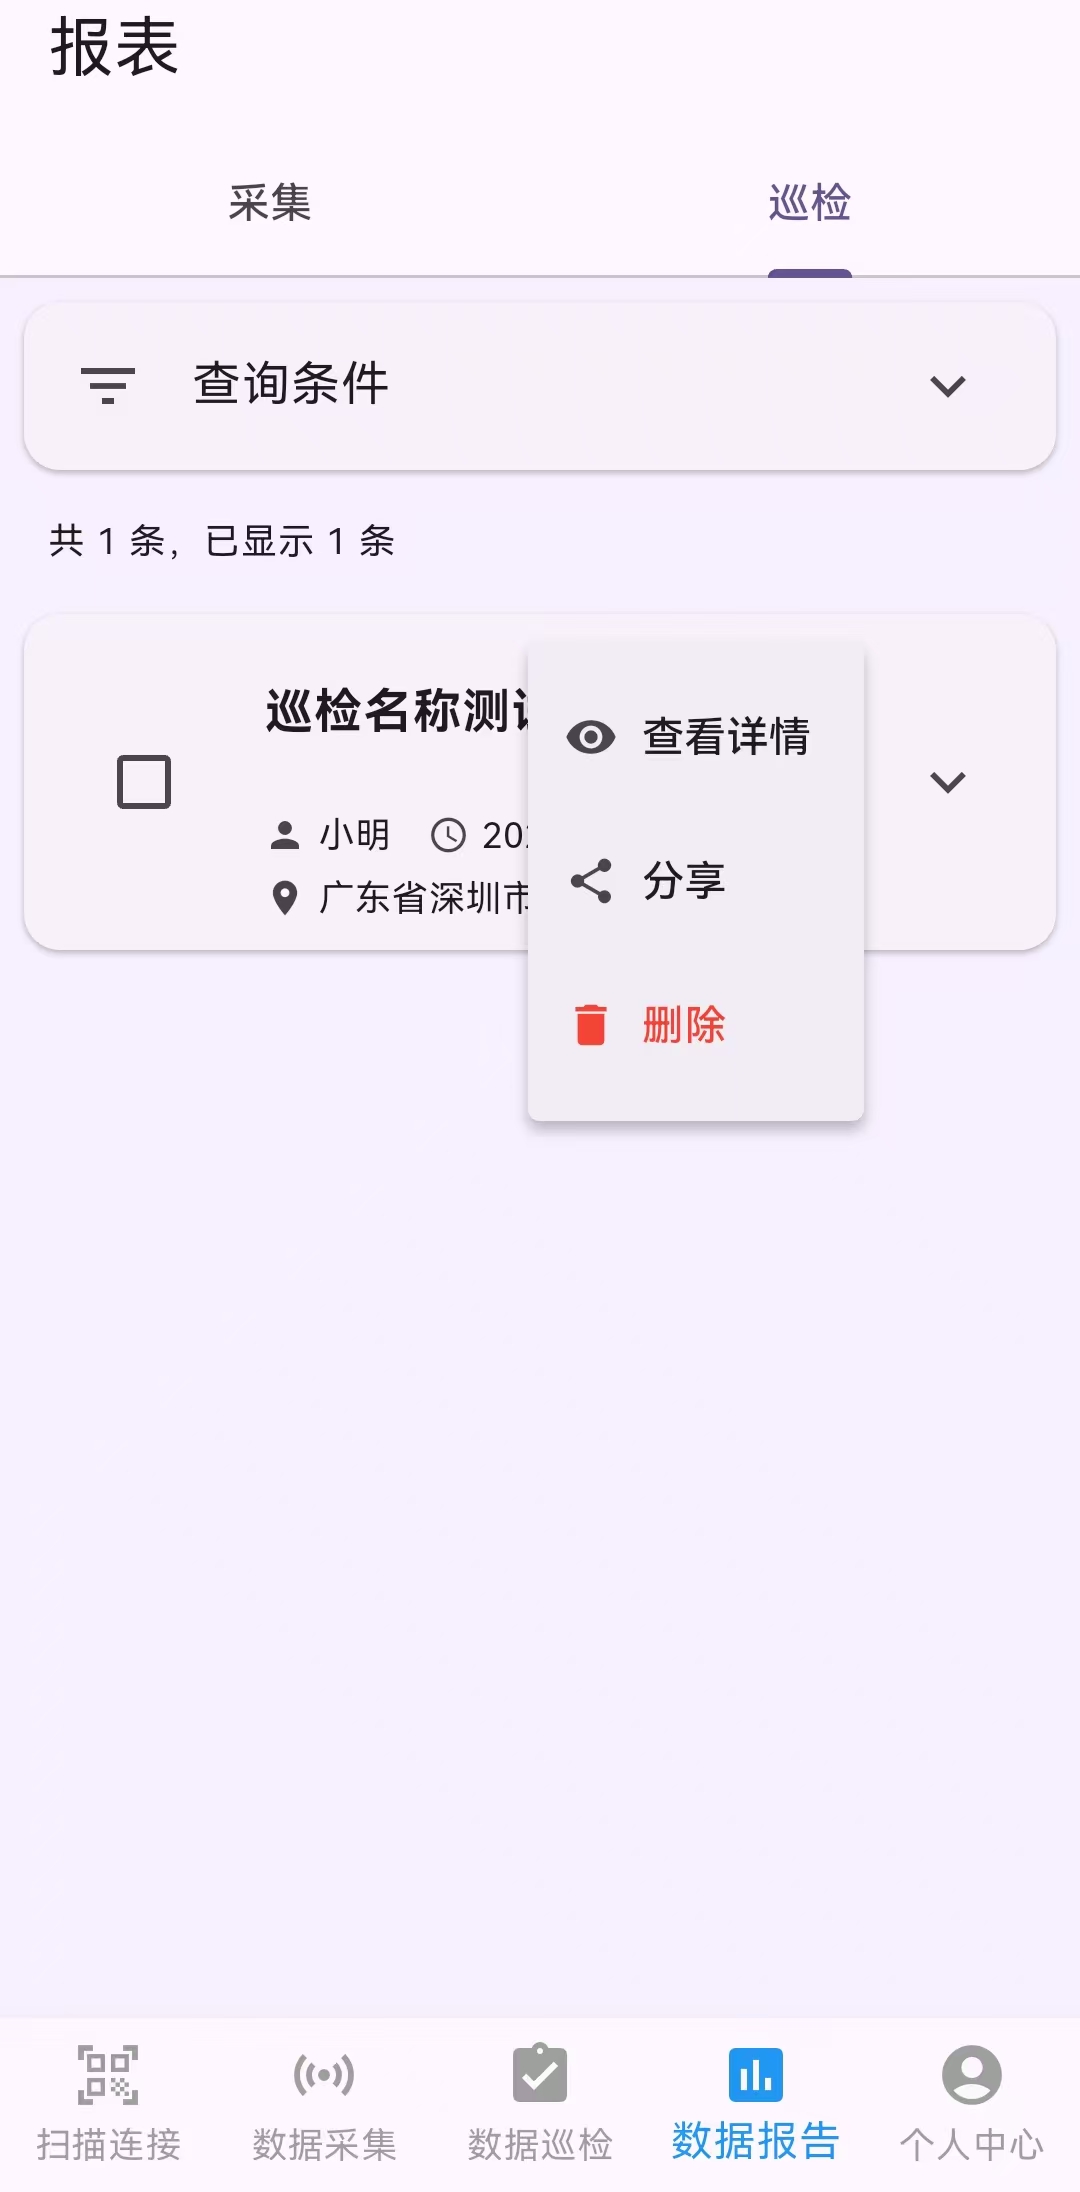
数据报告
查看采集和巡检的历史报告
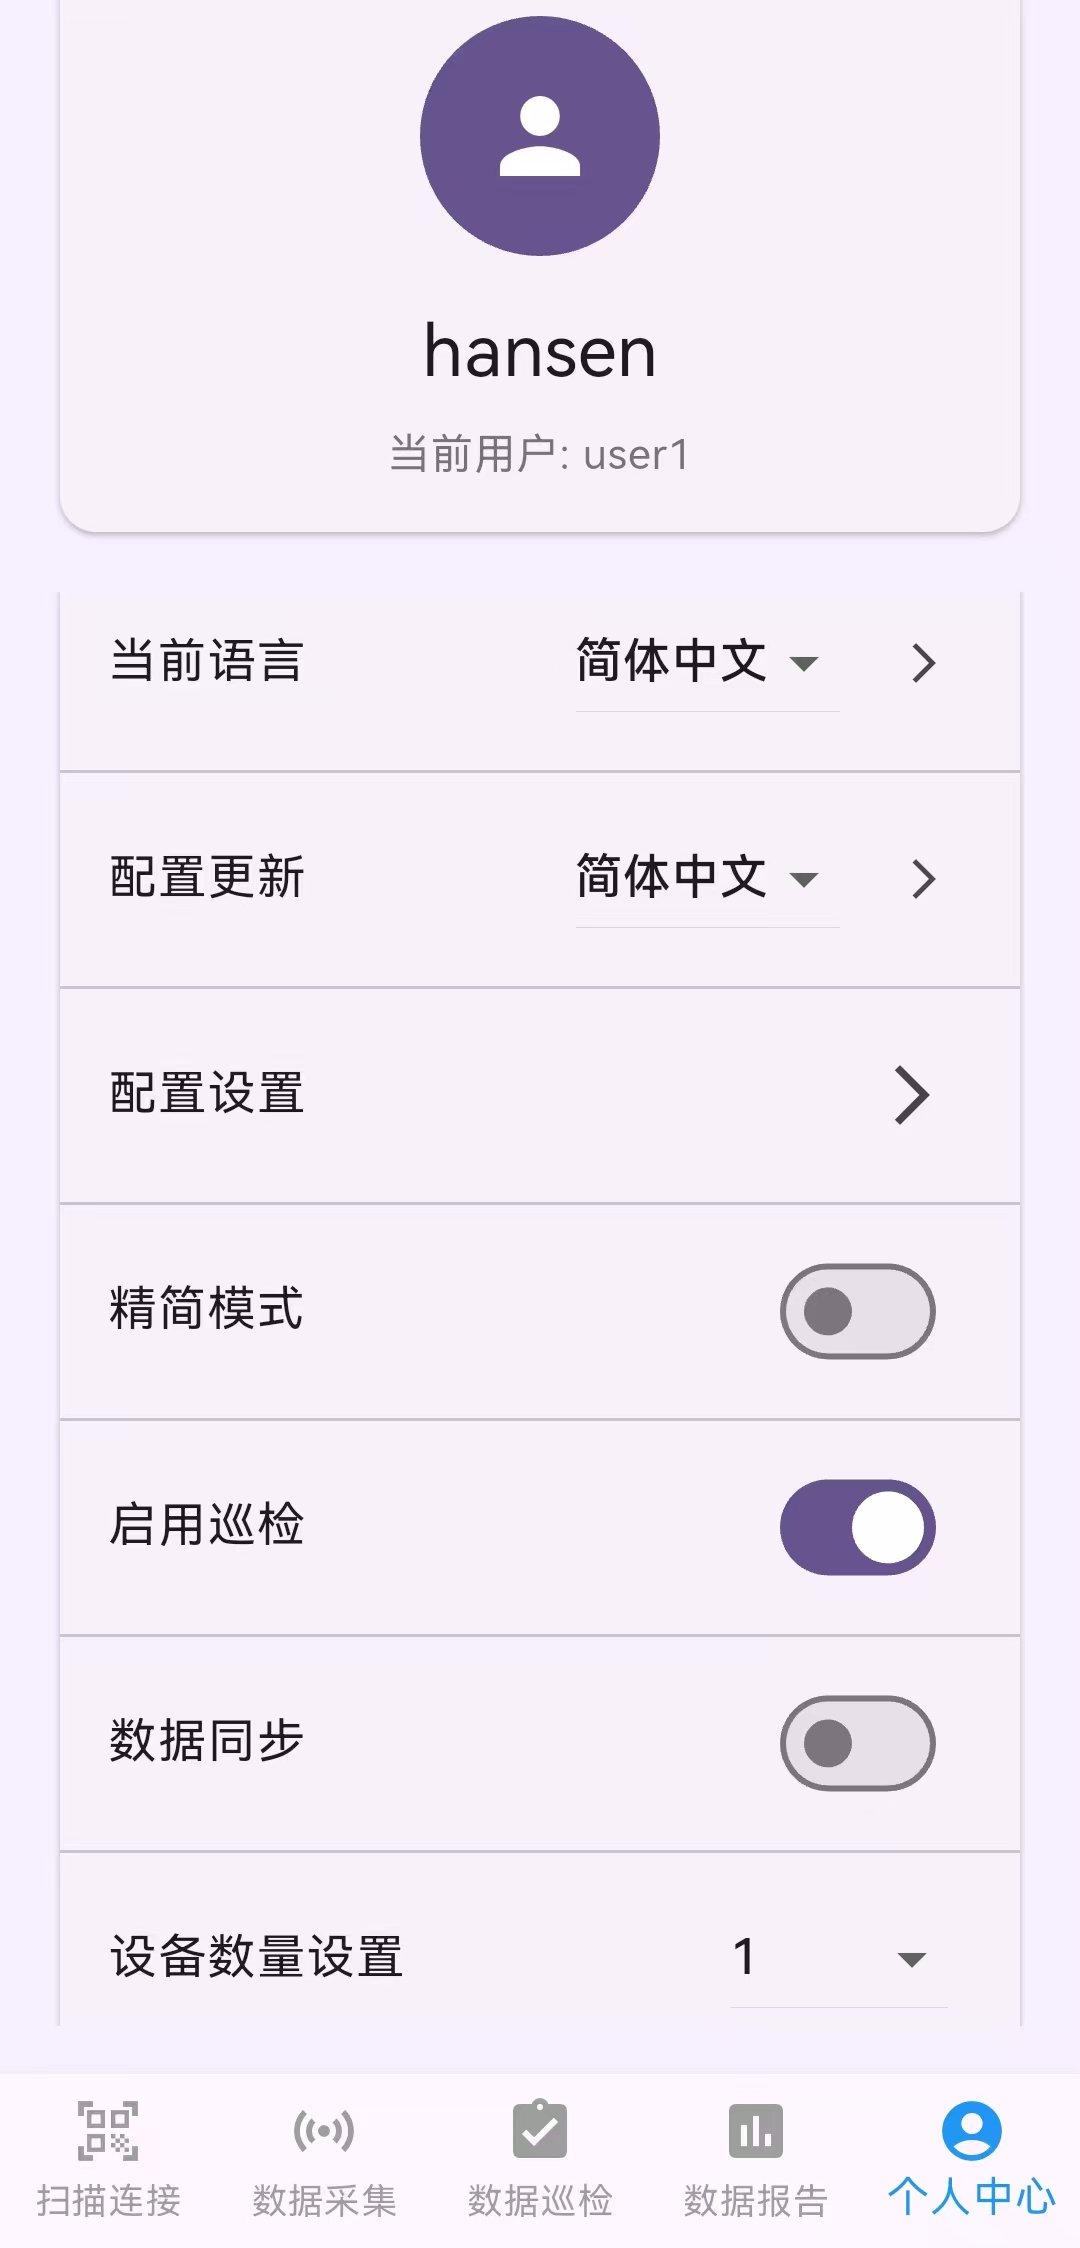
个人中心
登录、设置、同步等
打开应用后默认显示"扫描连接"页面。底部导航栏始终可见,点击即可切换至对应功能模块。
The app uses a bottom navigation bar with 5 main tabs:
Tab
Description
Scan
Scan & connect BLE devices
Collection
View real-time meter data
Inspection
Create & run inspection tasks
Report
View collection & inspection reports
Profile
Login, settings, sync, etc.
The app defaults to the "Scan" tab on launch. The bottom navigation bar is always visible for quick switching.
四、核心功能说明
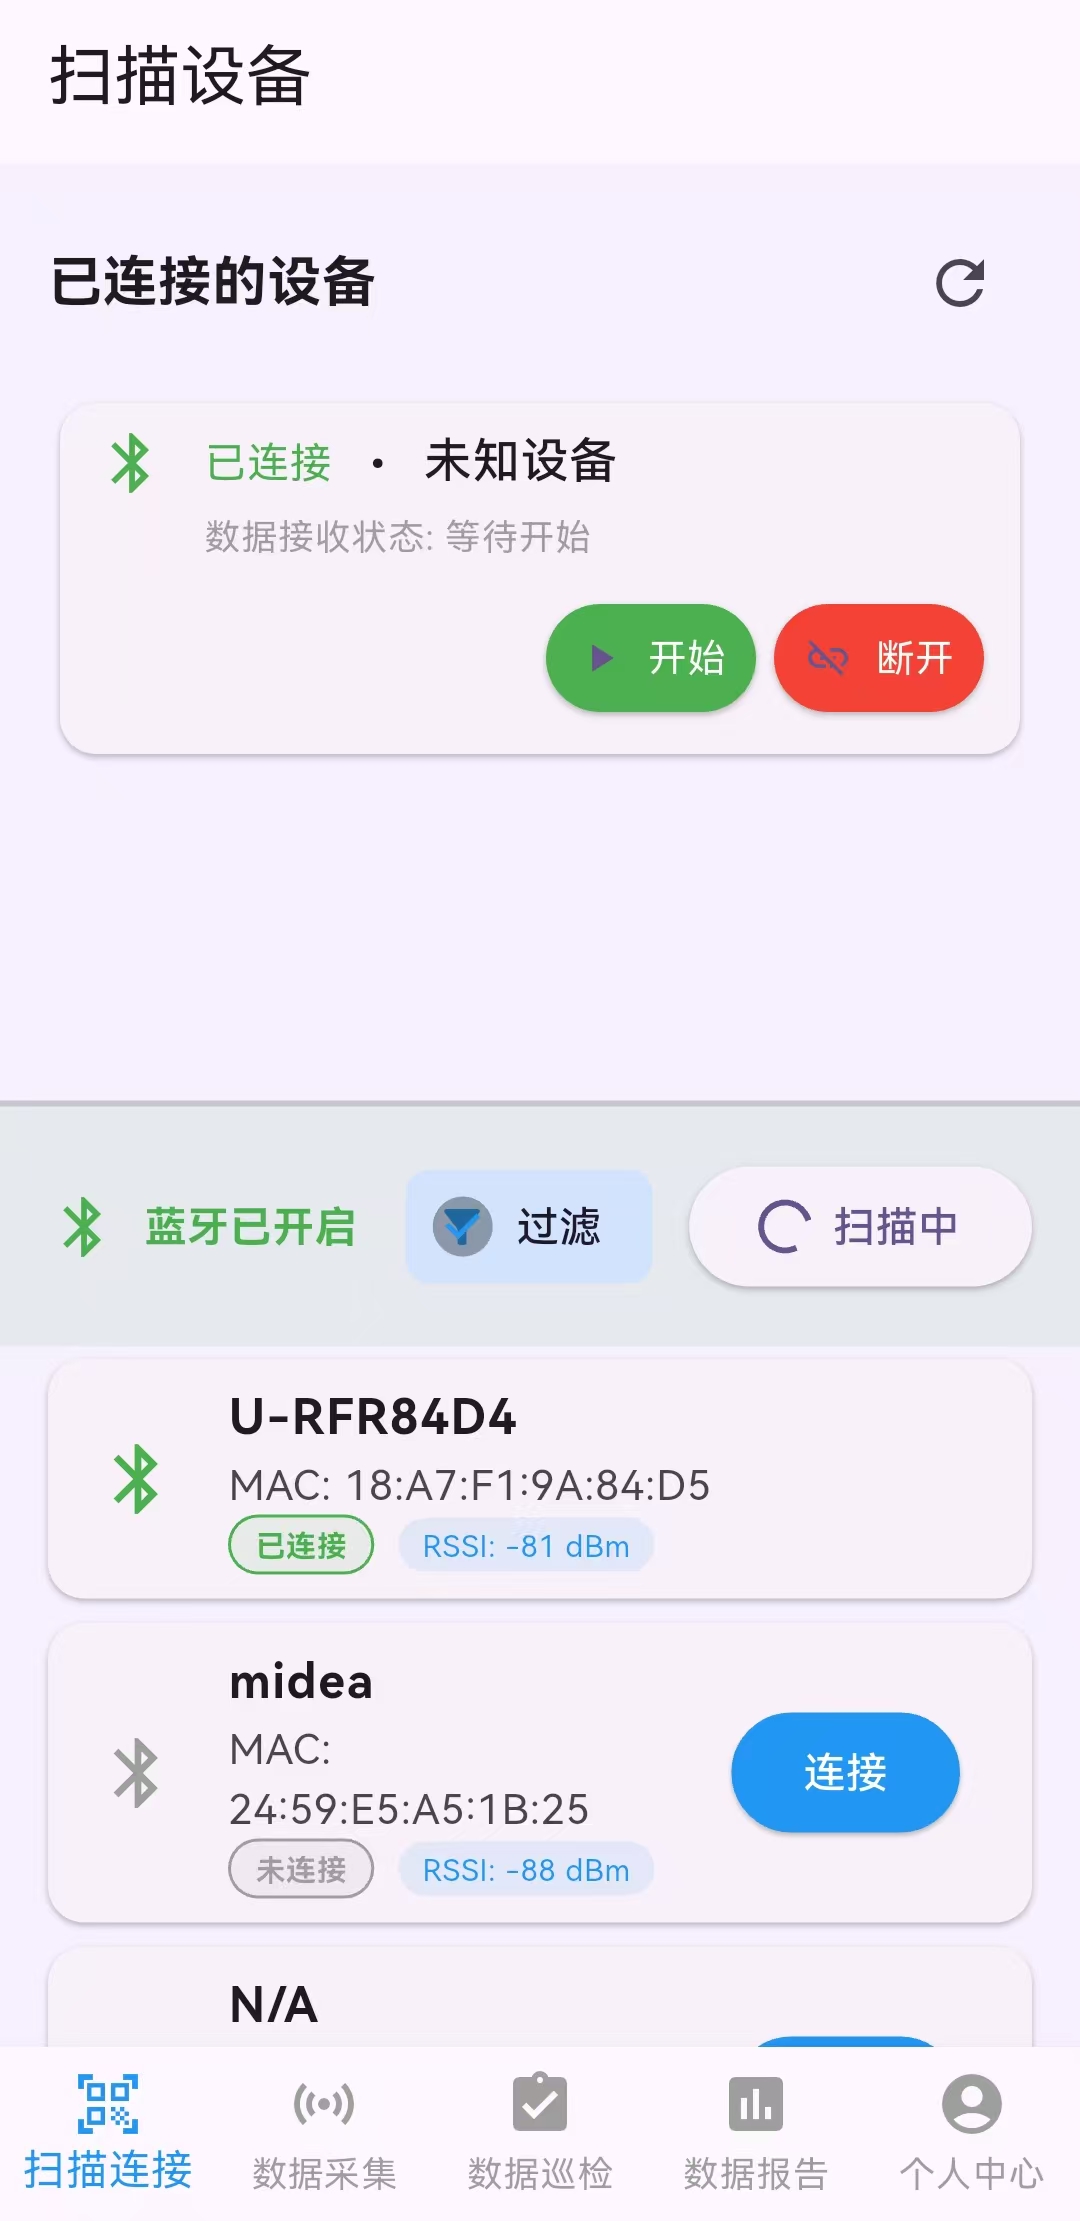
4.1 蓝牙扫描与连接
扫描附近蓝牙设备并建立连接
通过蓝牙低功耗(BLE)扫描附近的检测仪表设备,建立无线连接后实时接收测量数据。
使用步骤
确保手机蓝牙和位置服务已开启。
进入"扫描连接"页面,系统自动开始扫描附近设备。
在列表中找到目标设备,点击设备名称即可发起连接。
连接成功后,设备状态变为"已连接",将自动开始数据采集。
Scan nearby measurement instruments via BLE, establish wireless connections and receive real-time readings.
Steps
Ensure Bluetooth and Location services are enabled.
Go to the "Scan" tab; scanning starts automatically.
Tap a device in the list to connect.
Once connected, the status changes to "Connected" and data collection begins automatically.
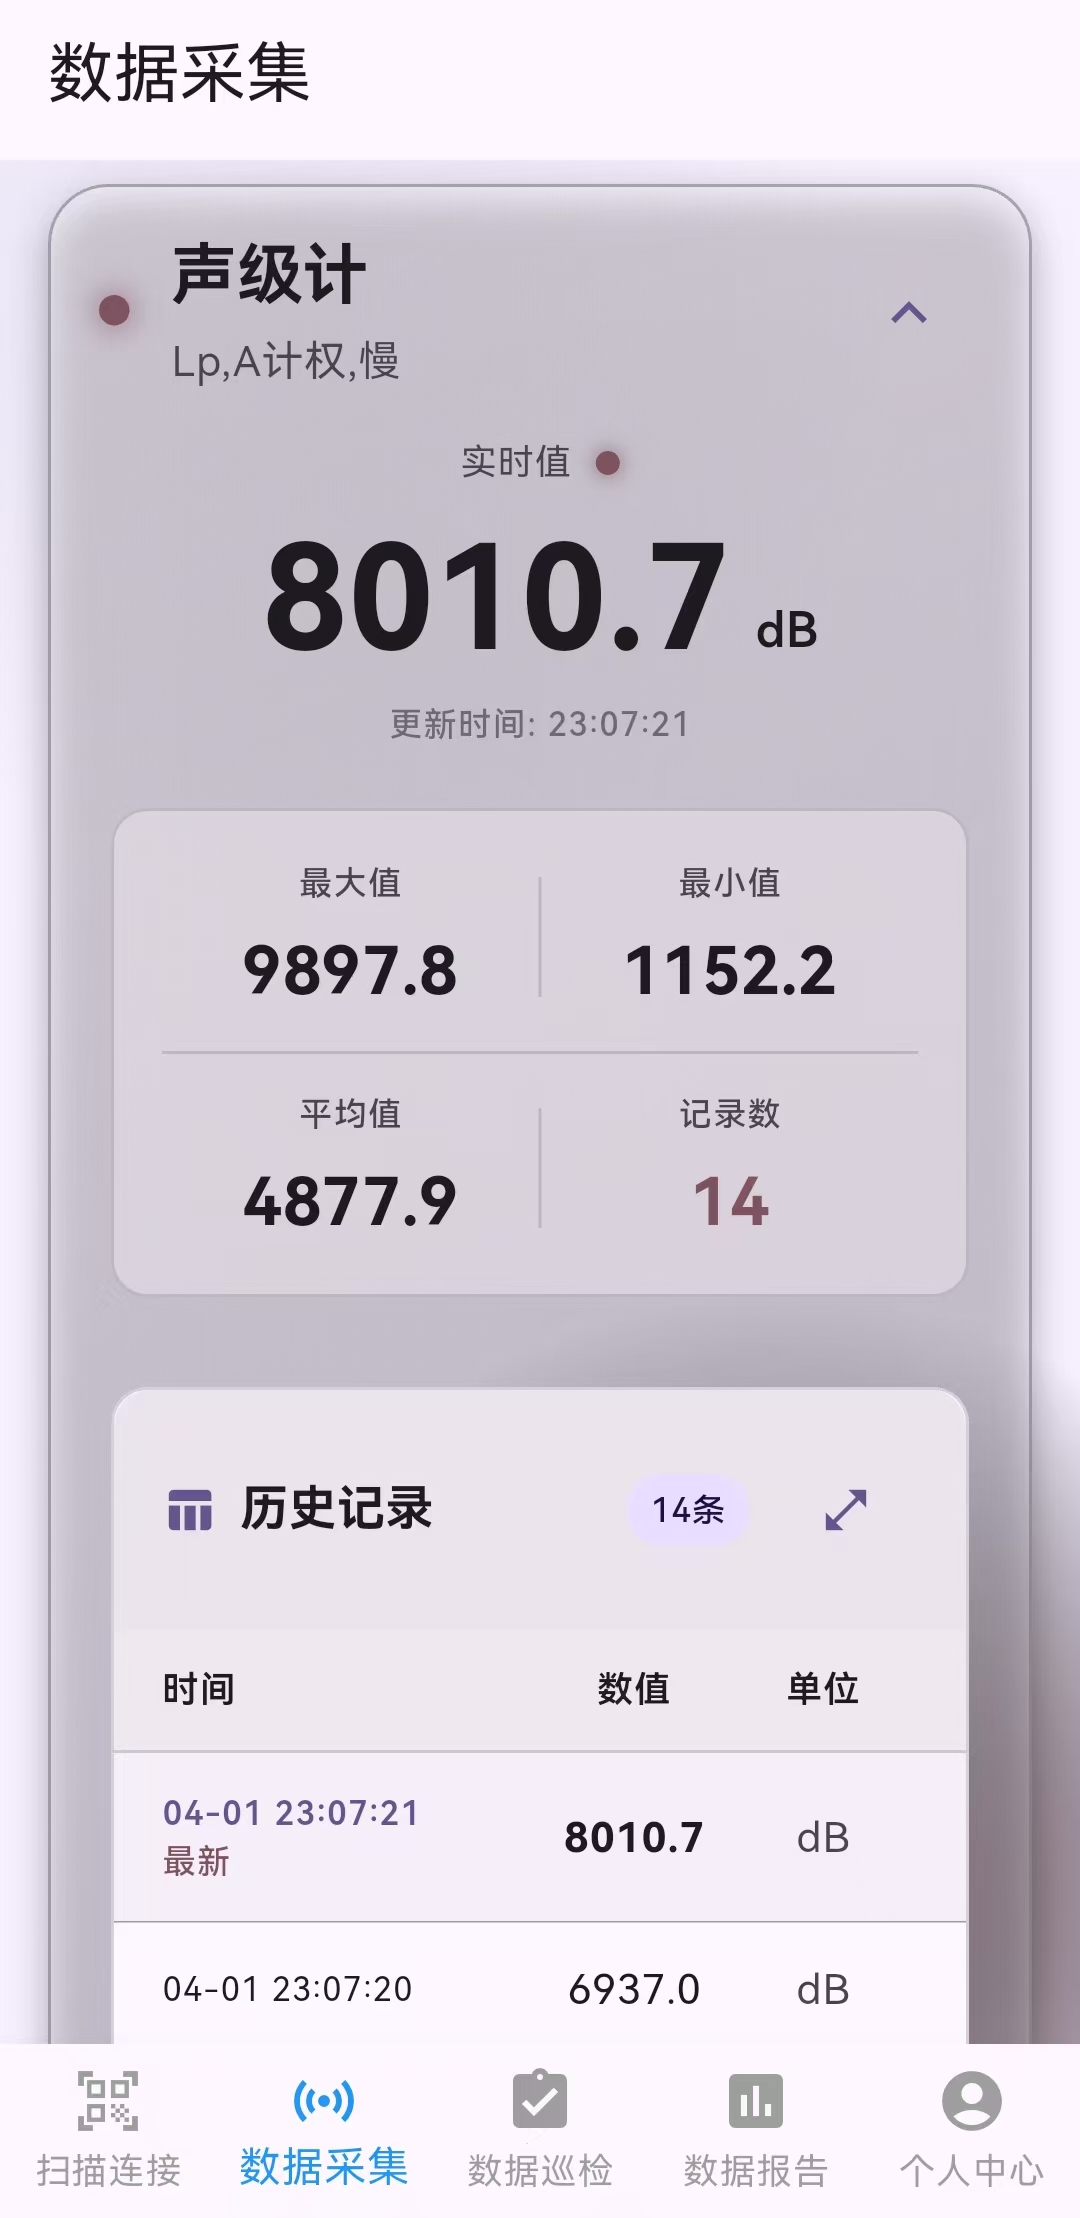
4.2 实时数据采集
实时接收并显示设备数据
表格方式呈现采集数据
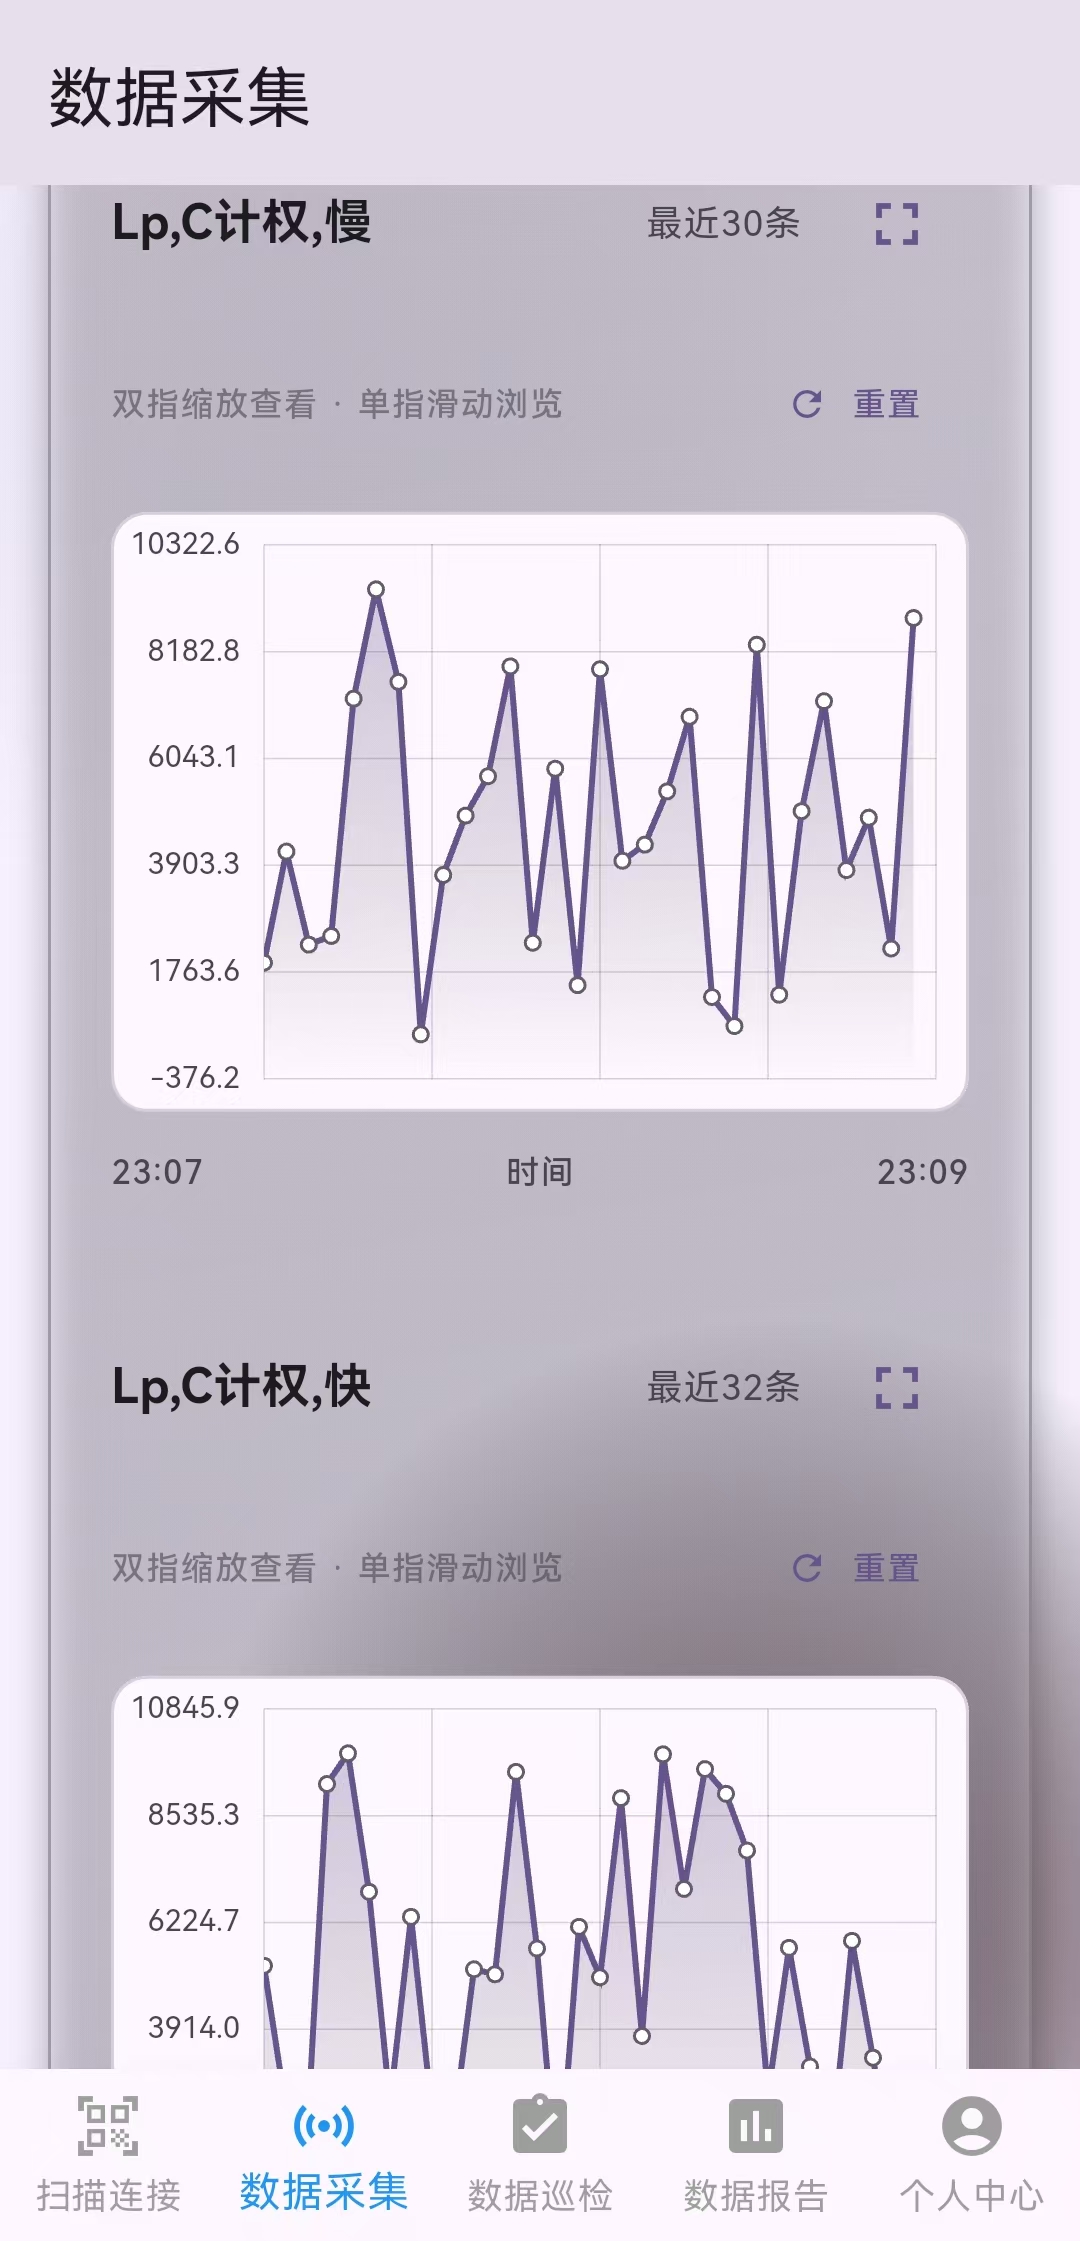
曲线图呈现数据趋势
连接设备后,自动采集转速(RPM)、温度、湿度等数据,以设备卡片形式实时显示,并提供图表可视化。
使用步骤
在"扫描连接"页面成功连接设备后,切换到"数据采集"页面。
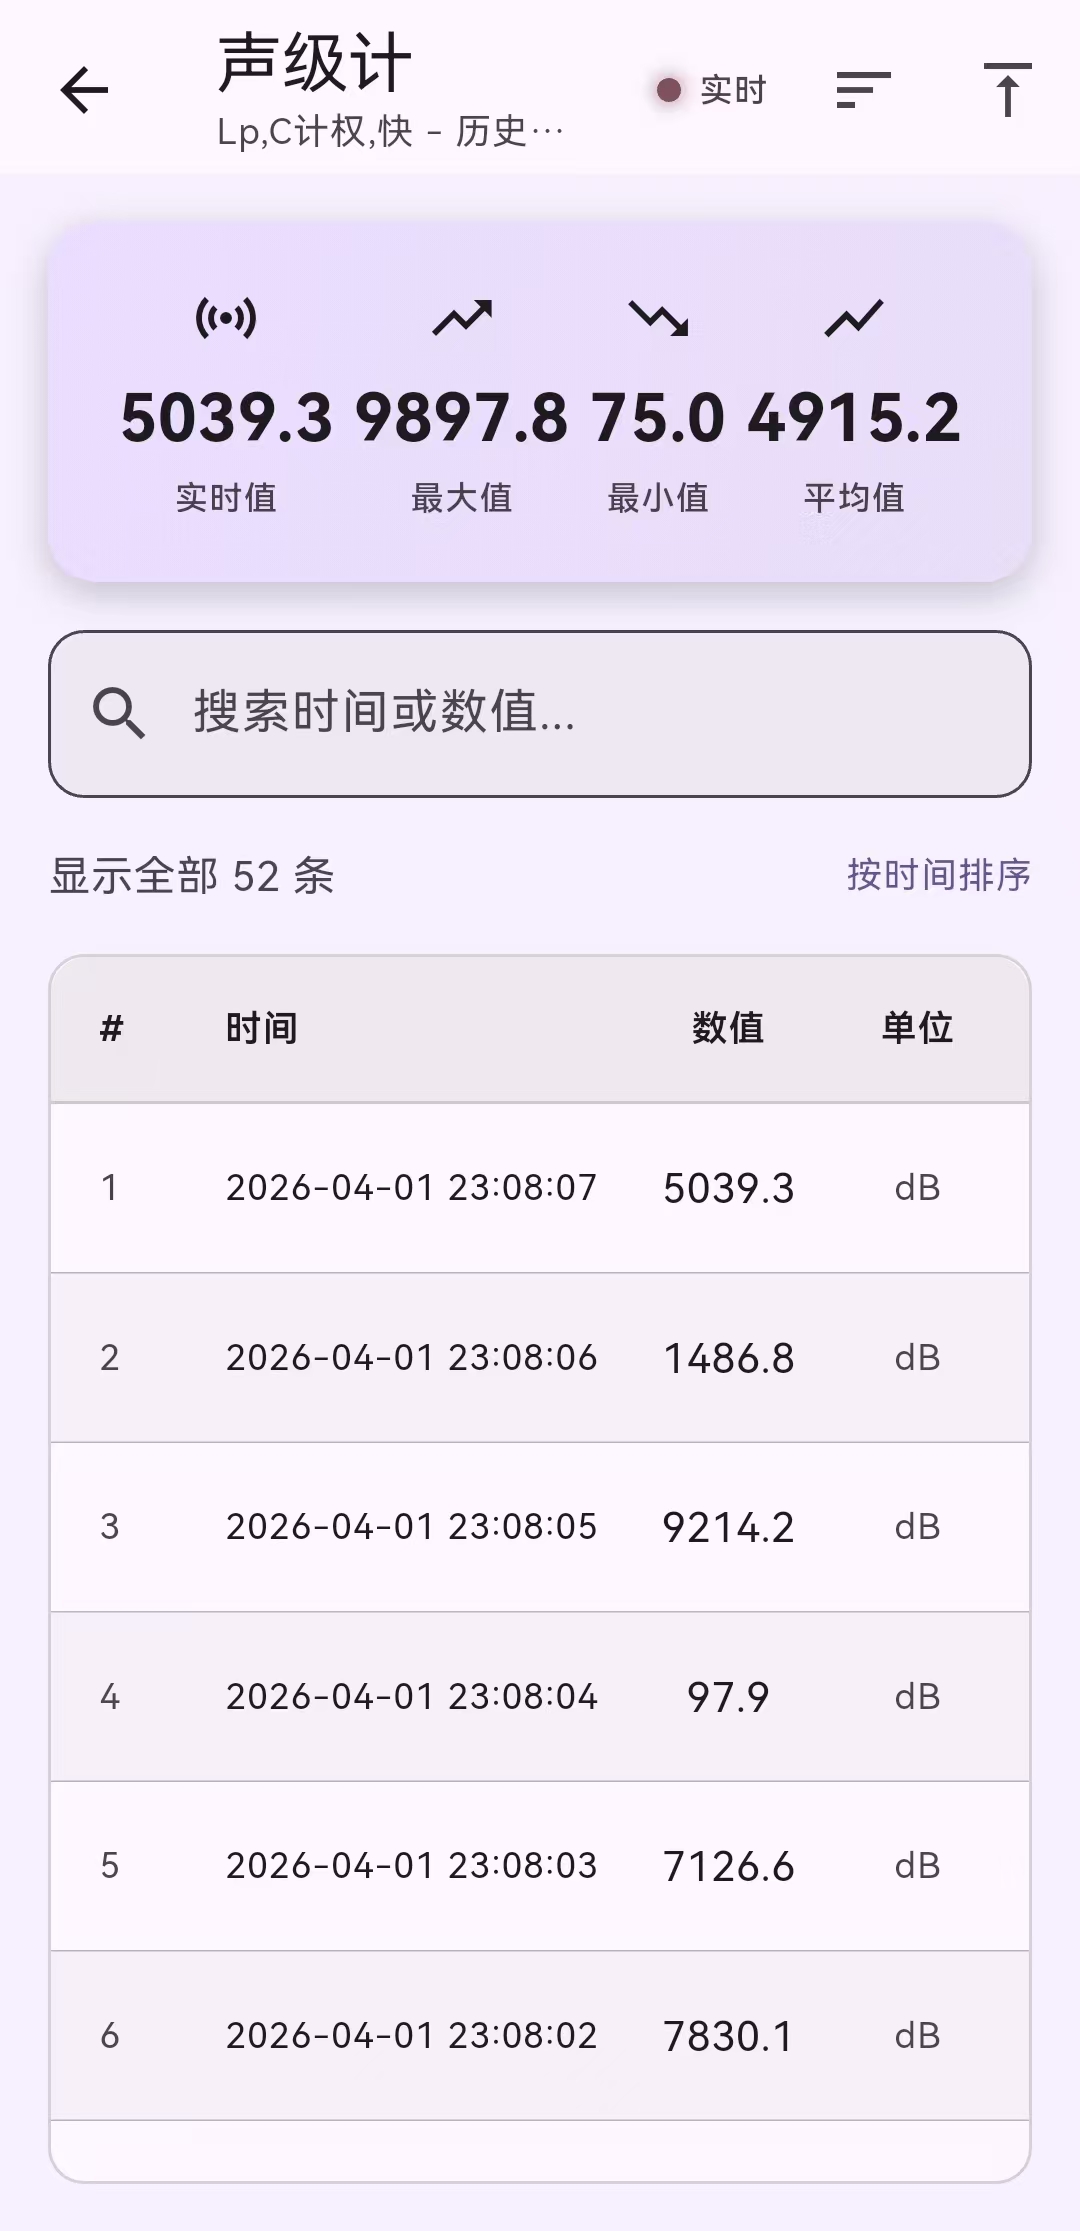
每个已连接设备会显示为一张可展开的卡片,包含当前值、最小值、最大值和平均值。
点击卡片可展开查看数据趋势图表,支持缩放和滚动。
数据按设备 ID 和测量单位自动分组。
精简模式
在"个人中心 → 设置"中可开启精简模式,将以原始数据列表形式显示。
After connecting to a device, readings (RPM, temperature, moisture, etc.) are collected automatically and displayed in real-time device cards with chart visualization.
Steps
After connecting a device in "Scan", switch to the "Collection" tab.
Each connected device shows as an expandable card with current, min, max, and average values.
Tap the card to expand and view trend charts; supports zoom and scroll.
Data is automatically grouped by device ID and measurement unit.
Lite Mode
Enable "Lite Mode" in "Profile → Settings" for a minimal raw data list view.